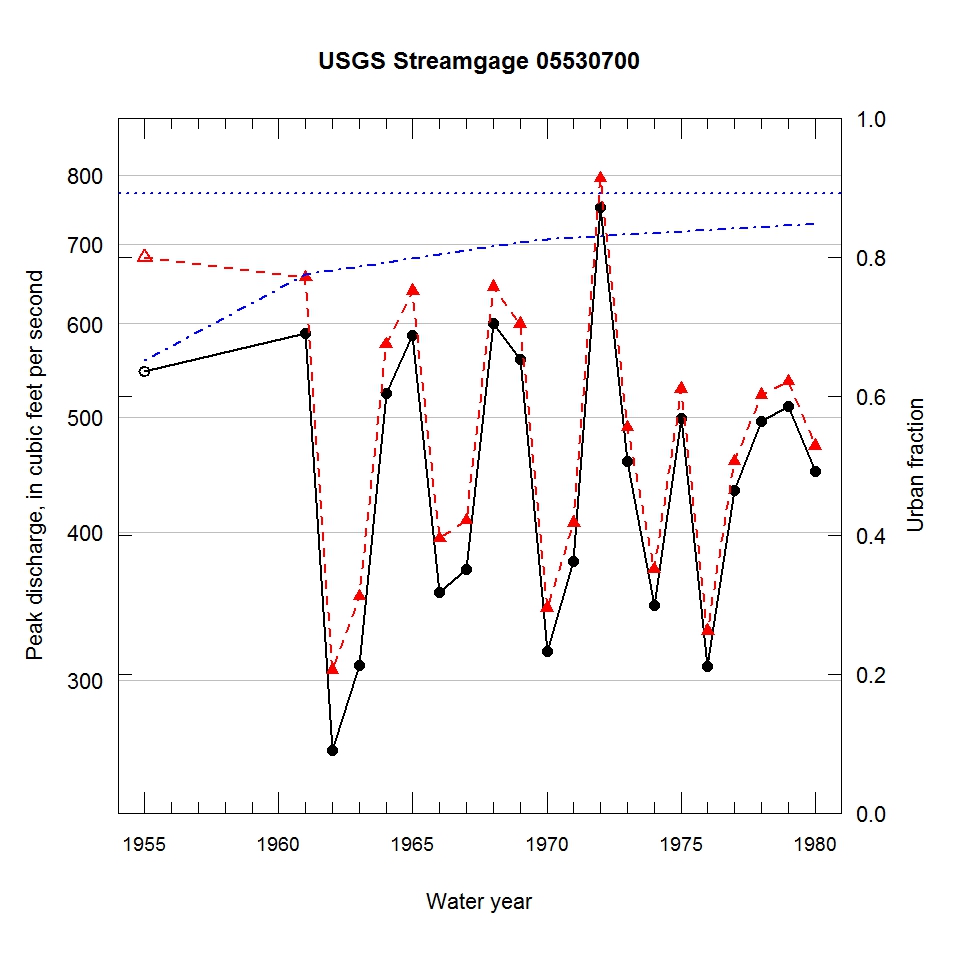
Observed and urbanization-adjusted annual maximum peak discharge and associated urban fraction and precipitation values at USGS streamgage:
05530700 SILVER CREEK AT MELROSE PARK, IL


| Water year | Segment | Discharge code | Cumulative reservoir storage (acre-feet) | Urban fraction | Precipitation (inches) | Observed peak discharge (ft3/s) | Adjusted peak discharge (ft3/s) | Exceedance probability |
| 1955 | 1 | 7 | 0 | 0.651 | 3.353 | 547 | 682 | 0.145 |
| 1961 | 1 | -- | 0 | 0.776 | 2.004 | 589 | 656 | 0.164 |
| 1962 | 1 | -- | 0 | 0.781 | 1.978 | 262 | 306 | 0.821 |
| 1963 | 1 | -- | 0 | 0.787 | 1.588 | 309 | 353 | 0.721 |
| 1964 | 1 | -- | 0 | 0.792 | 1.898 | 524 | 576 | 0.238 |
| 1965 | 1 | -- | 0 | 0.798 | 0.495 | 586 | 639 | 0.177 |
| 1966 | 1 | -- | 0 | 0.804 | 1.894 | 356 | 395 | 0.613 |
| 1967 | 1 | -- | 0 | 0.809 | 2.070 | 372 | 409 | 0.579 |
| 1968 | 1 | 2 | 0 | 0.815 | 2.086 | 600 | 644 | 0.173 |
| 1969 | 1 | -- | 0 | 0.820 | 0.807 | 560 | 599 | 0.211 |
| 1970 | 1 | -- | 0 | 0.826 | 1.039 | 317 | 345 | 0.738 |
| 1971 | 1 | -- | 0 | 0.828 | 1.205 | 378 | 407 | 0.584 |
| 1972 | 1 | -- | 0 | 0.830 | 1.292 | 752 | 795 | 0.080 |
| 1973 | 1 | -- | 0 | 0.832 | 0.482 | 459 | 490 | 0.408 |
| 1974 | 1 | -- | 0 | 0.834 | 0.756 | 347 | 372 | 0.674 |
| 1975 | 1 | -- | 0 | 0.837 | 1.385 | 499 | 528 | 0.317 |
| 1976 | 1 | -- | 0 | 0.839 | 1.693 | 308 | 330 | 0.769 |
| 1977 | 1 | -- | 0 | 0.841 | 0.349 | 434 | 459 | 0.471 |
| 1978 | 1 | -- | 0 | 0.843 | 1.899 | 496 | 522 | 0.332 |
| 1979 | 1 | -- | 0 | 0.845 | 1.135 | 511 | 536 | 0.300 |
| 1980 | 1 | -- | 0 | 0.847 | 0.676 | 450 | 473 | 0.443 |

